Mapping a Corn Maze with a GPS watch

The entrance to the maïsdoolhof: La Vuelta themed

A few weeks ago I did a corn maze with a friend. In honor of La Vuelta that recently passed nearby, the maze was Vuelta/bike themed. I turned on my Garmin watch to see if I would be able to see the pattern in our path.

The goal of the maze was to find all the numbered posts and their associated letter. Once you found all (or enough) of the letters, you can rearrange them to discover the phrase. We were able to find all but two letters, couldn’t guess the phrase, and turned to the cheat sheet to find the last two.

The elevated platform didn’t offer much help for solving the maze

Disclaimer: this post is decidedly not in the software section. We just enjoyed wandering the maze and took no optimal routes!

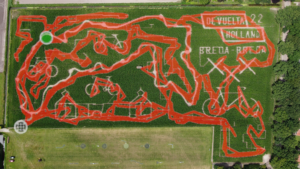
Our path from the Garmin GPS on the actual maze

As you can see, it didn’t record the path very well. Unfortunately the resolution was not high enough to make out much of the maze. I had left the Garmin on its default of “Smart Recording.” However, “Every Second Recording” might have yielded higher resolution and better results.

Steam Board Game Notification Bot in Discord

I’ve been playing a board game online with some friends. Since we’re spread across the world, we all take our turns at different times. The board game runs through Steam, and Steam’s turn notifications are unreliable and easy to miss. So the easiest way to see if it’s your turn is to load up the game. However, that can be frustrating to take the time to load it up only to see it’s not your turn yet. There must be an easier way to quickly and easily see whos turn it is.

That’s where my friends (mainly jcsung) and I came up with a discord bot that will check whos turn it is. Any time it’s a new persons turn it posts a notification to a discord channel. If it’s your turn you can be @ tagged. That way it takes minimal effort to see whose turn it is, and you get a persistent notification when it’s your turn.

I refrain from naming the game or releasing the code here. I’m not sure whether my use of the game’s API is condoned, and I don’t want it to get shut down.

Method

Technologies used:

Steam on the Raspberry Pi

We setup a raspberry pi with its own running Steam client and account that owns the board game. It needs to be a separate account that owns the board game, rather than an instance of one of our own accounts, so that it doesn’t interfere when the player launches the game on their own machine. We tried running the bot as the notorious Steam test game SpaceWar (480), but that didn’t work, so we needed to buy the actual game for the account. We were also lucky that in the board game’s API, any user can access the data for a game being played, and not just the players in the game.

The first step our bot does is authenticate with the locally running Steam client and get an access token, using SteamworksPy.

steamworks = STEAMWORKS()
steamworks.initialize()
session_ticket = steamworks.Users.GetAuthSessionTicket()

Game API

We used Fiddler to capture the API traffic between the game and its servers to understand what API calls were needed to get game info. The http responses are in JSON, and with some experimentation we got what the important info is, specifically: the authentication protocol, whose turn it is, whether the game has started, whether the game has completed, and how much time is left in the turn.

We use the session ticket from Steam to authenticate with the game’s servers using the http api. After authenticating, it sends a request to the server every 5 minutes to get the game state, and parses whose turn it is from the response. When it detects a new person’s turn it posts to the discord channel, using nextcord. Players can also register to be @ tagged when it’s their turn.

Results

For myself and others, this bot has made playing a more enjoyable experience. I don’t need to load the game to see whose turn it is and I get a notification through discord when it’s my turn.

This bot was developed while a game that was taking especially long was in progress, and part of the annoyance with the game’s speed lead to this bot. The bot was planned, built, debugged and deployed all while that game was continuing to be played.

Event Date Turn number
Game Started 2021-11-16 0
Bot fully deployed 2022-01-14 106
Game Over 2022-02-10 170
Before deployment 1.8 turns/day
After deployment 2.4 turns/day

The table above is the timeline of the bot’s deployment during the game. Turns are counted as an individual player action, either in regular turn order, or an out-of-turn action by a player that’s triggered by another player’s action.

The timeline of the game was accelerated by about a third with the use of the bot. Moreover, it saves the one or two minutes of loading the game each day to see whose turn it is, often only to discover that it’s not yet your turn. Now we only need to briefly check for a discord notification.

The bot seems to be successful from a qualitative improvement of the gameplay experience and from quantitative time savings and acceleration of gameplay.

Choosing the Optimal Turn Order for Board Games

For those of us that play board games with friends online, especially games that take multiple days, waiting for friends to make their turn can stir some impatience. While waiting for my turn in a game against friends across 3 countries and 4 time zones I realized our turn order was less than ideal given our schedules. This presented a great opportunity to work on my React skills and make our games run faster. Thus I created a board game scheduler to choose the optimal turn order for board games that minimizes wait time based on everyone’s schedules and time zones.

Theory

board_game_schedule

The image above is a hypothetical schedule. Each number represents the hour of that person’s local time with UTC time at the top. Green squares represent when that person is available to play. It’s quickly apparent that if the turn order is top down then two rounds can be played per day, but if it’s bottom up then there is less than one round per day. The goal is to find the most turns per day possible.

I turned to Graph Theory. Each playable hour (green square) is a vertex in a graph, and each edge points to the next player’s playable hour. The weight of each edge is how many hours away the next player’s turn is. The rules are:

  • A green–or available–square points to the square below it with an edge weight of 0.
  • An unavailable square points to the square to the right of it with an edge weight of one.
  • When an edge points beyond the bottom or right of the grid, it wraps back to the top or left.
  • From the above, each vertex can only point to one other vertex, but each vertex can have bewteen zero and two vertices pointing to it.
  • All vertices are adjacent to their connecting vertices.

We can try different permutations of player orders, construct the graphs, and pick the graph and turn order that provides the optimal solution. It’s tempting to phrase the graph as a shortest path problem, but that unfortunately doesn’t work. What we want to do is find the cycle with the maximum rounds per total weighted path. That means the cost function is dependent not just on weights, but also the number of vertices visited. However, there are some other tricks we can use.

Because each vertex only points to one other vertex and all vertices are adjacent to their connecting vertices, it creates some useful features for solving this:

  • Multiple closed and separate cycles (of the same length) can exist in one graph.
  • However, any closed cycle is equal to the optimal solution for the graph.

The first point is simple: you can have two possibilities of timing as long as they have the same path length. For example, in the image below there are two cycles for a turn order running from top to bottom. One starting at 11 and one at 19 in Japan. The second feature in the list is key to solving the problem: any closed cycle is an optimal cycle. If there was a more and less frequent cycle in the same graph, the more frequent would intercept with the less frequent (because all vertices are adjacent to their connecting vertices), and thus the less frequent one would become part of the more frequent one.

schedule_2_closed_cycle

The solution is then to traverse the map until a cycle is found, because any cycle is an optimal cycle. Once a cycle is found, recurs back to the meeting point and subtract the edge weights (hours) and turns to get the amount of hours and turns in the cycle. With that you can get the optimized rounds per day.

The traversal of the map will need to be completed for each permutation of player order. We can start with the first player on the schedule without permutation because turn order is what matters, not who starts. Unfortunately, this permutation of players gives a run time of (n-1)!. If too many players are added, the algorithm becomes prohibitively slow. For now this is working well enough for my friends and I, but possible future solutions might be to reuse or not recreate the map traversal for each permutation.

Guus Meeuwis’ “Brabant” Lyrics Translation

Brabant

Living in Noord-Brabant it’s hard to avoid songs from Guus Meeuwis, especially “Brabant”. And I like the song. To practice my Dutch, I tried to translate “Brabant” to English. While I first made this translation a couple years ago, the lyrics seem more poignant in the middle of the pandemic and lockdowns.

Translation to English

A warm hat on my head
My collar stands up
It is ice cold here
But fortunately dry

The days here are short
The nights begin early
The people are stiff
And there is only one pub

As I walk to my hotel
After a dark day
I feel my house key
Deep in my pocket

[Chorus]
I walk here alone
In a city too still
I have never really suffered
From homesickness
But the people are sleeping
The world is closing
Then I think of Brabant
Because there the lights are still on

I miss the warmth
Of a neighborhood pub
The conversation of people
With a soft g

I even miss the complaining
About everything and nothing
If only those in Brabant
Were as proud as a Frisian

In the South full of sun
I live together with you
That is why I so
Love Brabanders

[Chorus]

The Peel and The Kempen
And The Meierij
But the best part of Brabant
Is you, that is you

[Chorus]

[Chorus]

Exporting Eufy Smart Scale’s raw data from android

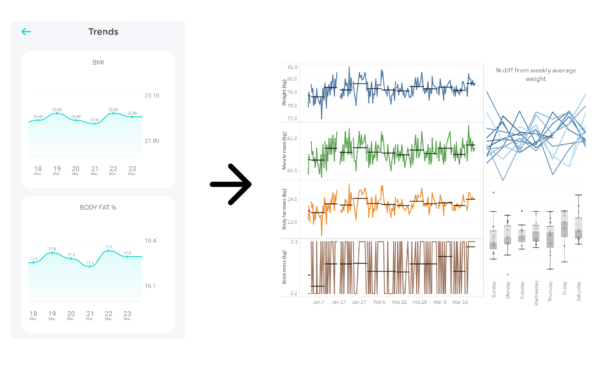
From a default to a custom chart.

Eufy Smart Scale and App

I recently purchased a Eufy Smart Scale. Not only does it automatically record my weight and upload it to the Eufy app, it also provides a breakdown for details like muscle mass, body fat, and more. While I enjoy having the data conveniently recorded, the charts fail to answer questions I have. Like how does my data vary over periods of more than a week? Is there a correlation between time of day and my weight, or day of the week and weight? To answer these questions and more, I wanted to get Eufy Smart Scale’s raw data off my phone and onto my computer. While these steps are specific to Eufy’s app, they can work for other android apps, too.

Getting Eufy Smart Scale’s raw data

To get the data, some special software is required. Fortunately, you do not need to root your phone to make it work. While these steps are focused on Windows, they should also work for Mac or Linux with a few changes.

      1. First, create a folder for us to work in. We’ll say “smart_scale”.
      2. Now you need to download  adb (https://developer.android.com/studio/releases/platform-tools) to your PC, and extract the archive to the “smart_scale” folder. adb is a tool for debugging android apps, but for us it also allows us to download data from apps on a device.
      3. You also need Android Backup Extractor (https://sourceforge.net/projects/adbextractor). Download and extract the archive and copy “abe.jar” in “android-backup-tookit\android-backup-extractor\android-backup-extractor-20180521-bin” to the “smart_scale” folder. Note that “20180521” may change depending on your version. Android Backup Extractor will extract the data from adb.
      4. Enable debugging on your android device (https://developer.android.com/studio/command-line/adb#Enabling). This allows adb to connect to the device.
      5. Plug your android device into the PC with USB. If prompted on the android device, select “Allow USB debugging.”
      6. Open a command prompt and navigate to the “smart_scale” folder.
      7. Now we export the data from the device using adb. From the command prompt, run
        platform-tools/adb backup -noapk com.oceanwing.smarthome

        Enter (and remember) a password when prompted on the android device. The name ‘com.oceanwing.smarthome’ can be seen as the app name in the Google Play Store URL.

      8. You should now have a file titled “backup.ab” in your folder containing the app data.
      9. Extract the backup by running the following from the command line, and when prompted enter the password you just made.
        java -jar abe.jar unpack backup.ab backup.tar

        Note that you may need to change “20180521” depending on what version of abe you have.

      10. “backup.tar” is now created in your “smart_scale” folder. Unpack it using your favorite file archiver (like 7-zip). You’ll see the raw data as a SQLite database at “apps\com.oceanwing.smarthome\db\EufyLifeDB.db”.

Accessing the Data in SQLite

You can access the data with SQLite

      1. Download SQLite3 tools from https://www.sqlite.org/download.html, and extract the archive to your “smart_scale” folder
      2. Access the database from the command line with 
        .\sqlite-tools-win32-x86-3350300\sqlite3.exe .\apps\com.oceanwing.smarthome\db\EufyLifeDb.db

        Note that you may need to change versions or folders in that command depending on your setup.

      3. View a list of tables with the “.tables” command, help with “.help”, or see the full documentation at https://www.sqlite.org/cli.html.

Visualizing the Data with Tableau

You can use many ways to access and visualize SQLite data. I used Tableau, and connected to the data using the SQLite instructions found here: https://help.tableau.com/current/pro/desktop/en-us/odbc_customize.htm. Use the table name “bodyfathistorym” in the data source pane. One thing to note is that after connecting to the database, it’s helpful to create an extract. SQLite doesn’t support many common database operations, which means Tableau won’t be able to perform certain data operations. To see my own visualization, look below or see it on Tableau Public.

And to answer one of my initial questions: it seems that my weight increases throughout the week until the weekend, when it drops, possibly because I’m working less and outside more. If I wanted to lose a couple kilos, maybe one option is to exercise more during the week.

Notable columns in Eufy Smart Scale’s raw data

The table “bodyfathistorym” contains the interesting data, and within it, some of the notable columns are as follows.

Column Name Description
createtime Unix time when the weighing occurred
weight Total weight (kg)
impedance and encryptionimpedance Presumably used to calculate values like muscle and fat mass
bodyfat and bodyfatmass Body fat in % and kg respectively
muscle and musclemass Muscle mass in % and kg respectively
bone and bonemass Bone mass in % and kg respectively